
Mobile app retention strategies work in a fixed order of leverage: activation first, then habit loops, then notification restraint, then performance.
Personalization comes last, and most teams reach for it far too early. Each lever moves one specific metric, which is how you tell whether the change worked.
Fix Activation Before Anything Else
Most teams treat retention as a late-stage problem. Users are leaving, so they send more push notifications, add gamification, or run a re-engagement campaign.
When you look at where volume actually drops, it's almost always in the first session. A user who never reaches the "aha moment" can't be retained, because they were never truly acquired.
The single highest-leverage mobile app retention strategy is fixing your activation funnel. Activation percentage, meaning the share of new users who complete the core value action within their first session or first 24 hours, predicts D7 and D30 retention better than any downstream metric.
If your activation rate sits at 20%, doubling it to 40% moves your entire retention curve upward without touching anything else.
Instrumenting this requires defining your activation event precisely. For a fitness app, that might be completing one workout. For a fintech product, linking a bank account.
Log that event with a timestamp and user ID, then build a funnel from install through activation with intermediate steps visible. A basic telemetry setup in Firebase Analytics logs app_open, onboarding_step_1, onboarding_step_2, and activation_complete, each carrying a user_id and session_id property.
Cohort users by install date, then compute activation rate per cohort. D1 signal shows up fast, often in 48 to 72 hours with a few hundred installs per cohort, so you'll spot onboarding friction within days.
A practical A/B test for onboarding changes works with a simple two-arm split. Arm A gets your current onboarding, Arm B gets the variant with fewer screens, deferred sign-up, and progressive disclosure of permissions.
Your primary metric is activation rate. Run the test until you hit statistical significance at 95% confidence, which usually requires 1,000 to 2,000 users per arm depending on your baseline conversion rate. Track D7 retention as a guardrail to confirm the activation improvement translates downstream.
Onboarding A/B Test Structure
Arm | Variant | Primary Metric |
|---|---|---|
Arm A | Current onboarding flow | Activation rate (baseline) |
Arm B | Fewer screens, deferred sign-up, progressive permissions | Activation rate (variant) |
Habit Loops and Reasons to Return
Once users activate, the question shifts to frequency. How do you get users to come back to your app without relying on brute-force notifications?
The answer sits in habit grammar, a framework built on three components that work together: a trigger, a reward, and low friction.
The trigger is the reason a user thinks of your app at a specific moment. For Tracer Golf, a product we built that surpassed 13,200 downloads, the trigger was natural, because finishing a round of golf created an immediate desire to review shot data.
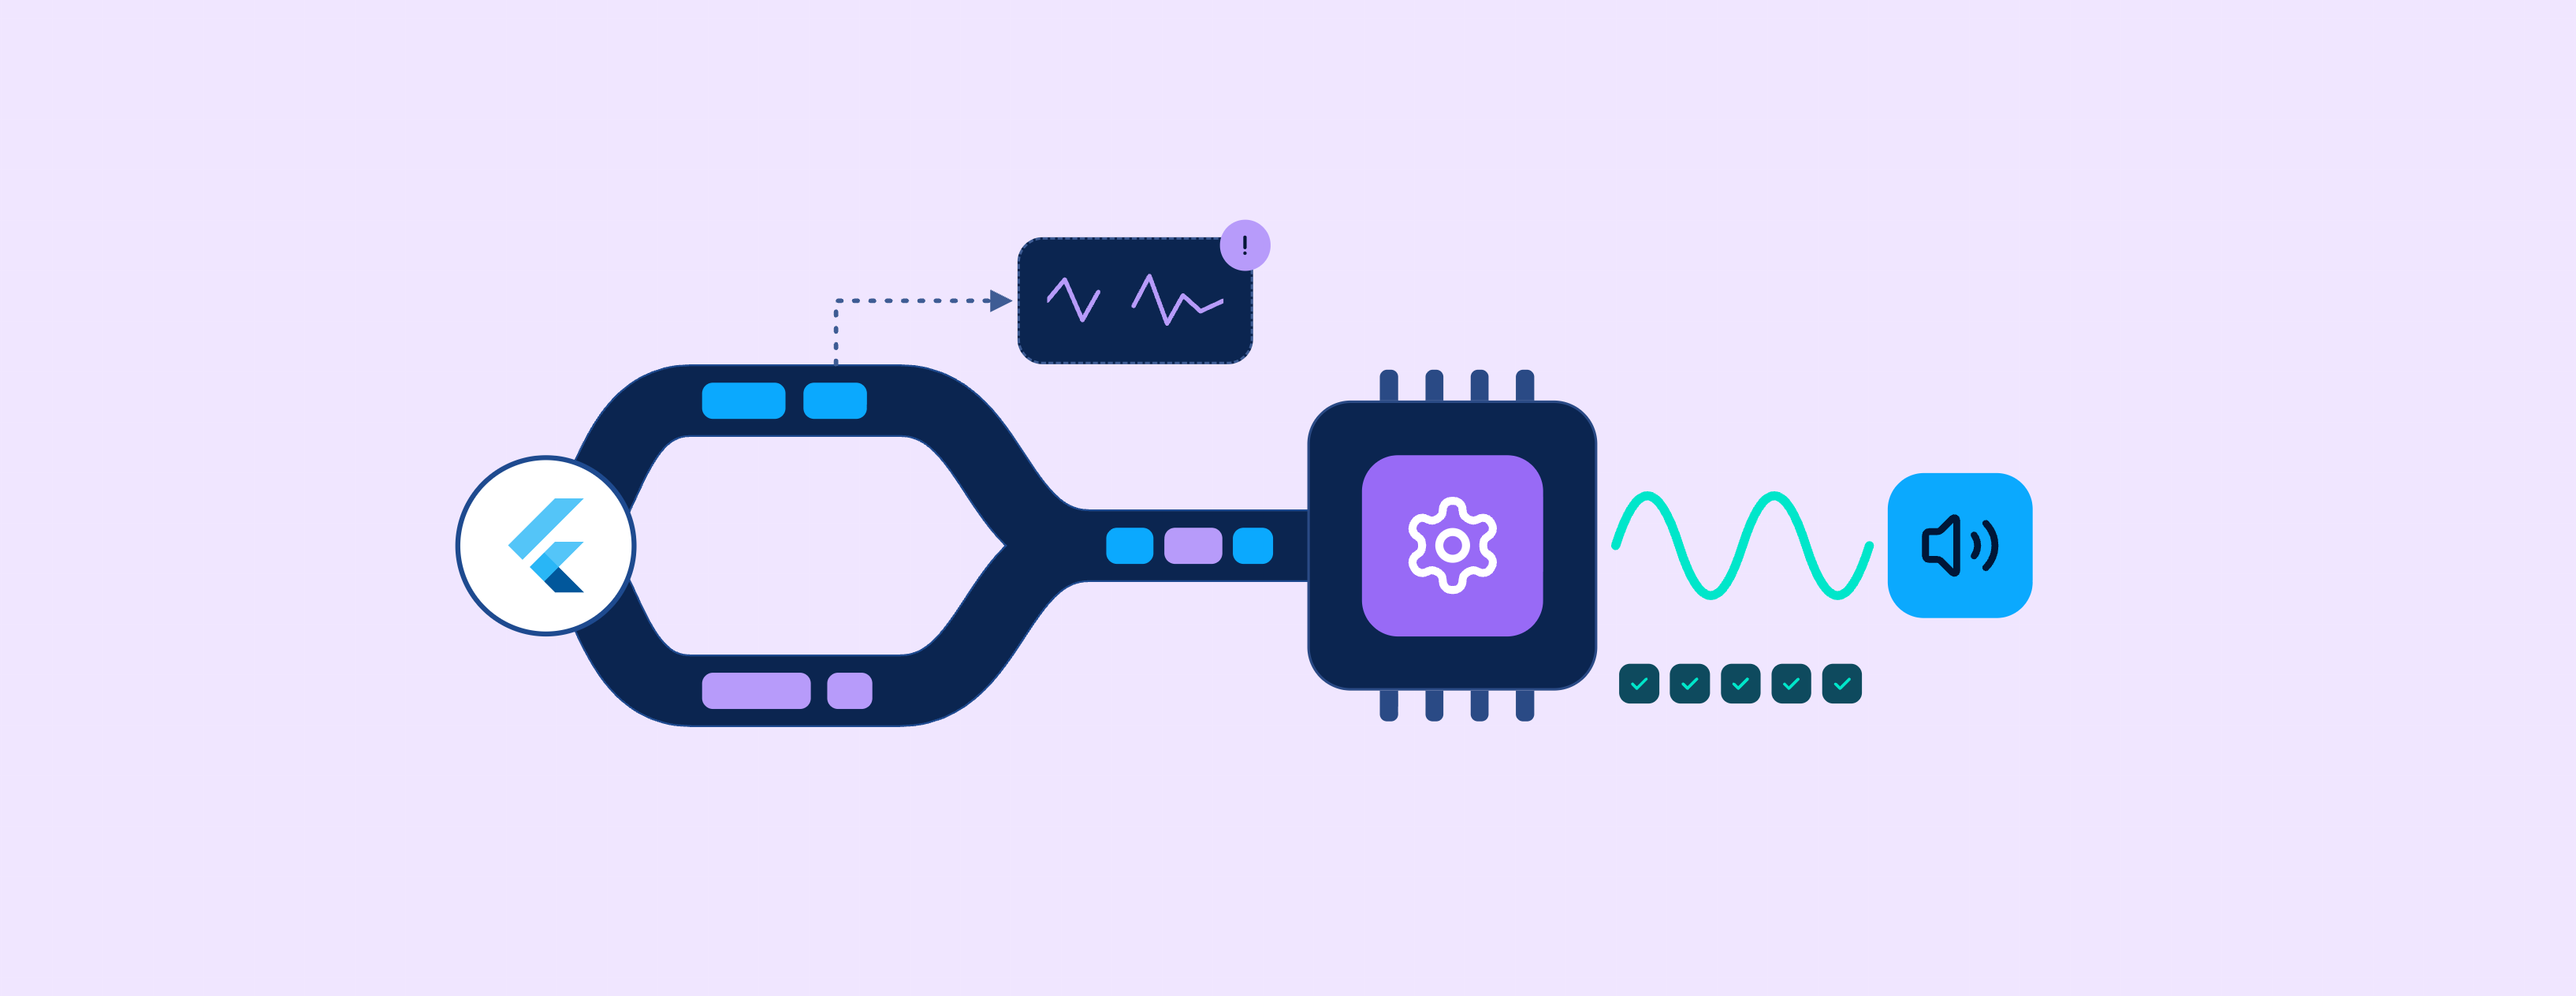
The reward was seeing performance trends over time. Friction was minimal because the app ran on a single Flutter codebase across iOS and Android, which meant consistent UX and fewer platform-specific bugs disrupting the experience. Session frequency and D7 retention confirmed the loop was working.
You can instrument habit loop health by tracking session frequency distribution. Log each session_start event, then compute sessions per user per week, segmented by days since install.
Healthy habit formation shows up as stable or increasing session frequency for users in weeks 2 through 4. If frequency declines linearly, your reward isn't strong enough or your trigger isn't firing.
A sample A/B test for notification restraint splits users into three arms. Arm A receives your current cadence, Arm B receives only trigger-based notifications tied to incomplete actions, and Arm C receives no notifications for the first 7 days.
Your primary metric is D7 retention, with notification opt-out rate as a secondary signal. Teams running this test commonly find that trigger-based notifications outperform both high-cadence messaging and silence, because relevant triggers connect to real user intent.
Notification A/B Test Structure
Arm | Notification Policy | Expected Outcome |
|---|---|---|
Arm A | Current cadence | Baseline D7 retention |
Arm B | Trigger-based only (incomplete actions) | Higher D7 retention, lower opt-out rate |
Arm C | No notifications for first 7 days | Lower D7 retention than Arm B |
Performance and Personalization as Retention Multipliers
Runtime performance is an underrated user retention strategy for mobile apps. Startup time correlates with churn hazard, particularly for apps with session durations under two minutes. If your app takes 4 seconds to reach interactive state, you're losing users before they ever see your value proposition.
The metric to track is churn hazard rate segmented by device performance tier. Log app_start_time, the delta between process start and first meaningful paint, then segment your retention data by quartile of startup time.
If the bottom-performing quartile shows D7 retention well below the top quartile, performance optimization becomes a high-ROI investment. Flutter's widget rendering pipeline offers specific optimization paths: reducing widget rebuilds, deferring heavy operations off the main isolate, and caching network responses.
A two-week performance sprint targeting startup time and jank reduction costs a fraction of a personalization engine buildout, and it applies to your entire user base rather than a segment of it.
Personalization requires sufficient behavioral data to segment effectively, which means it only works for users who have already been retained long enough to generate that data.
That's why personalization is often premature. If your D7 retention is below 20%, investing in ML-driven content personalization targets a shrinking audience. Fix activation, habit loops, and performance first.
Once your retention curve flattens, meaning you have a stable cohort of retained users at D30, personalization becomes the lever that increases LTV by deepening engagement within that cohort. The metric shifts to LTV per user segment, and you'll need 6 to 12 weeks of D30 data before you can evaluate whether the change worked.
Reading the Retention Curve
Every mobile app retention strategy eventually comes down to the retention curve, the visualization of what percentage of a cohort remains active at D1, D7, D14, D30, and beyond. The shape of that curve tells you which intervention to prioritize.
What the Retention Curve Shape Reveals
- A steep drop between D0 and D1 points to activation problems that need to be addressed before any other lever.
- A gradual decline from D1 to D7 suggests weak habit loops where the trigger or reward isn't compelling enough to drive return sessions.
- A flat curve that suddenly drops at D14 often indicates a notification policy that's burning out users.
Acting on noise is worse than waiting for a reliable signal. D1 retention changes show signal within 3 to 5 days with adequate sample size, D7 retention needs 1 to 3 weeks, and D30 requires 6 to 12 weeks of patience.
The most effective way to increase app retention is to stack interventions in order of signal speed, starting with activation for fast feedback, then layering notification and habit loop changes, then evaluating performance and personalization.
Intervention Signal Speed
- Activation changes produce visible signal within 3 to 5 days because D1 data accumulates quickly with even modest install volumes.
- Notification and habit loop adjustments require 1 to 3 weeks before D7 retention data becomes statistically reliable.
- Performance and personalization changes demand 6 to 12 weeks of D30 cohort data before any conclusion is valid.
For funnel and cohort analysis, build a dashboard that shows activation rate, D1/D7/D30 retention, session frequency, churn hazard by device tier, and LTV by acquisition source. Update cohorts weekly.
What Separates Teams That Improve Retention
When a metric moves, cross-reference it with the specific change you shipped to that cohort. That instrumentation discipline is what separates teams that improve mobile app retention from teams that only measure it.
The ordering matters as much as the tactics. Activation before habit loops, habit loops before performance, personalization only once there's a retained cohort worth personalizing for. Skipping ahead produces work that cannot be evaluated.
For a product with a real roadmap, that sequence turns retention from a quarterly worry into a set of experiments with known feedback windows.
Frequently Asked Questions
What is the single most impactful thing a team can do to improve mobile app retention?
Fixing the activation funnel tends to produce the highest return, because a user who never completes the core value action in their first session will not be retained by any downstream strategy. Doubling your activation rate moves the entire retention curve without requiring changes to notifications, personalization, or performance.
How many users do I need before my A/B test results are reliable?
For onboarding and activation tests, plan for 1,000 to 2,000 users per arm to reach 95% statistical confidence, though this varies with your baseline conversion rate. Running the test short of that threshold risks acting on noise rather than a real signal.
How often should push notifications be sent in the first week after install?
High-cadence messaging in the first week is the fastest way to drive opt-out rates up. A single trigger-based reminder tied to an incomplete action, sent 4 to 8 hours after that action, converts well without conditioning users to dismiss your notifications.
When does it make sense to invest in personalization?
Personalization requires enough behavioral data to segment users effectively, which means it only works once a stable cohort of retained users exists at D30. If D7 retention is below 20%, the personalization engine targets a shrinking audience and the investment is unlikely to pay off.
How does app startup time affect retention?
Startup time correlates with churn hazard, especially for short-session apps where the first few seconds are most of the experience. Segmenting your D7 retention by startup time quartile usually reveals a clear gap between the fastest and slowest device groups, which makes a performance sprint one of the highest-ROI retention investments available.
Working With Somnio Software
If you're searching for a trusted software development partner, look no further. Contact us today to learn how we can help you turn your vision into reality with our tailored, high-quality solutions.